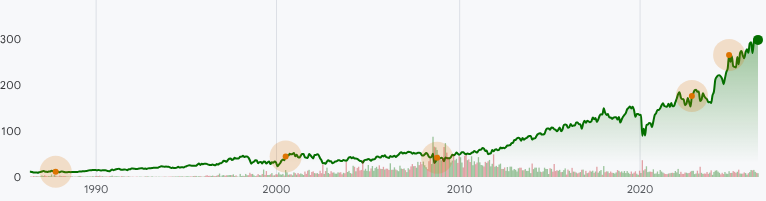
TRV:NYSE Stock Prices Over the Years
Annual Stock Price Performance
| Year |
Performance |
| 2026 |
1.47% |
| 2025 |
21.40% |
| 2024 |
28.13% |
| 2023 |
4.14% |
| 2022 |
22.96% |
| 2021 |
17.93% |
| 2020 |
4.88% |
| 2019 |
19.38% |
| 2018 |
-7.14% |
| 2017 |
14.78% |
| 2016 |
13.89% |
| 2015 |
9.52% |
| 2014 |
21.23% |
| 2013 |
27.24% |
| 2012 |
25.23% |
| 2011 |
9.09% |
| 2010 |
14.95% |
| 2009 |
13.48% |
| 2008 |
-11.40% |
| 2007 |
2.65% |
| 2006 |
19.39% |
| 2005 |
22.60% |
| 2004 |
-3.51% |
| 2003 |
16.70% |
| 2002 |
-19.39% |
| 2001 |
-12.17% |
| 2000 |
69.12% |
| 1999 |
-0.52% |
| 1998 |
-12.92% |
| 1997 |
44.08% |
| 1996 |
7.08% |
| 1995 |
29.60% |
| 1994 |
5.07% |
| 1993 |
20.66% |
| 1992 |
9.49% |
| 1991 |
22.28% |
| 1990 |
9.02% |
| 1989 |
43.21% |
| 1988 |
-2.04% |
| 1987 |
14.37% |
| 1986 |
-48.81% |
| 1985 |
51.42% |
| 1984 |
-10.06% |
| 1983 |
-0.41% |
| 1982 |
25.38% |
| 1981 |
26.54% |
| 1980 |
-3.73% |
| 1979 |
23.48% |
| 1978 |
7.69% |
| 1977 |
-11.58% |
| 1976 |
14.29% |
| 1975 |
-11.47% |