
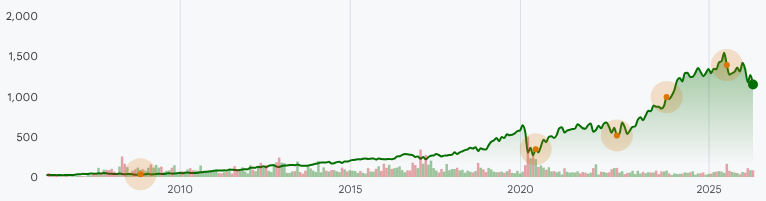
Annual Stock Price Performance
| Year | Performance |
|---|---|
| 2026 | -4.87% |
| 2025 | 13.33% |
| 2024 | 34.85% |
| 2023 | 67.60% |
| 2022 | 0.93% |
| 2021 | 8.27% |
| 2020 | 9.06% |
| 2019 | 84.63% |
| 2018 | 23.61% |
| 2017 | 19.09% |
| 2016 | 18.40% |
| 2015 | 15.52% |
| 2014 | 41.12% |
| 2013 | 33.24% |
| 2012 | 58.78% |
| 2011 | 29.74% |
| 2010 | 45.77% |
| 2009 | 67.82% |
| 2008 | -25.63% |
| 2007 | 77.76% |
| 2006 | 10.00% |