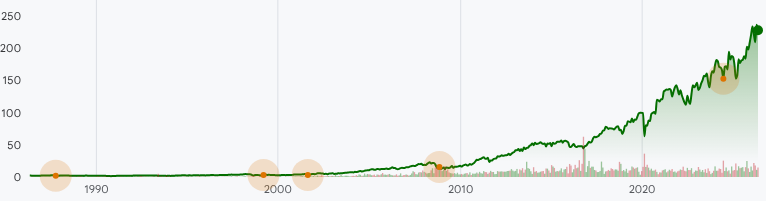
AME:NYSE Stock Prices Over the Years
Annual Stock Price Performance
| Year |
Performance |
| 2026 |
9.81% |
| 2025 |
15.54% |
| 2024 |
11.37% |
| 2023 |
18.13% |
| 2022 |
-2.09% |
| 2021 |
24.97% |
| 2020 |
20.90% |
| 2019 |
48.73% |
| 2018 |
-6.25% |
| 2017 |
48.09% |
| 2016 |
-7.00% |
| 2015 |
2.52% |
| 2014 |
1.67% |
| 2013 |
37.01% |
| 2012 |
34.22% |
| 2011 |
6.78% |
| 2010 |
53.41% |
| 2009 |
21.60% |
| 2008 |
-34.04% |
| 2007 |
48.30% |
| 2006 |
13.00% |
| 2005 |
20.03% |
| 2004 |
47.01% |
| 2003 |
24.85% |
| 2002 |
23.00% |
| 2001 |
32.05% |
| 2000 |
38.19% |
| 1999 |
-14.28% |
| 1998 |
-14.75% |
| 1997 |
27.63% |
| 1996 |
20.92% |
| 1995 |
14.34% |
| 1994 |
34.50% |
| 1993 |
-18.31% |
| 1992 |
24.35% |
| 1991 |
47.31% |
| 1990 |
-24.80% |
| 1989 |
11.76% |
| 1988 |
-7.45% |
| 1987 |
9.74% |
| 1986 |
-2.37% |
| 1985 |
21.82% |
| 1984 |
2.65% |