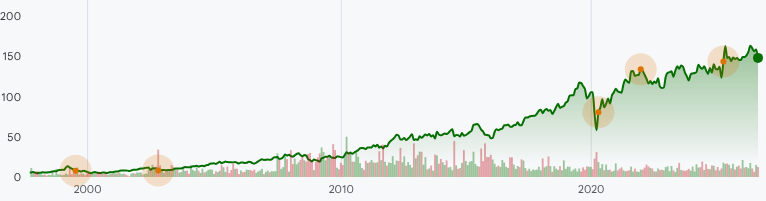
YUM:NYSE Stock Prices Over the Years
Annual Stock Price Performance
| Year |
Performance |
| 2026 |
-2.20% |
| 2025 |
14.92% |
| 2024 |
6.05% |
| 2023 |
4.85% |
| 2022 |
-4.39% |
| 2021 |
33.42% |
| 2020 |
8.30% |
| 2019 |
12.00% |
| 2018 |
14.62% |
| 2017 |
31.34% |
| 2016 |
24.88% |
| 2015 |
3.21% |
| 2014 |
-0.97% |
| 2013 |
14.85% |
| 2012 |
15.49% |
| 2011 |
22.66% |
| 2010 |
42.79% |
| 2009 |
11.94% |
| 2008 |
-15.17% |
| 2007 |
32.18% |
| 2006 |
27.10% |
| 2005 |
1.00% |
| 2004 |
41.43% |
| 2003 |
36.94% |
| 2002 |
0.94% |
| 2001 |
54.05% |
| 2000 |
-11.56% |
| 1999 |
-19.74% |
| 1998 |
72.10% |
| 1997 |
-0.21% |