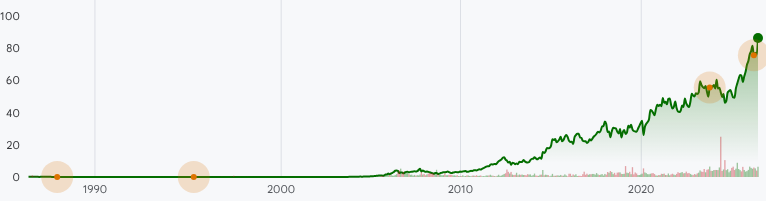
MNST:NASDAQ Stock Prices Over the Years
Annual Stock Price Performance
| Year |
Performance |
| 2026 |
14.76% |
| 2025 |
46.57% |
| 2024 |
-10.29% |
| 2023 |
13.72% |
| 2022 |
5.17% |
| 2021 |
6.00% |
| 2020 |
45.18% |
| 2019 |
30.33% |
| 2018 |
-21.51% |
| 2017 |
38.98% |
| 2016 |
-7.84% |
| 2015 |
37.72% |
| 2014 |
62.25% |
| 2013 |
24.97% |
| 2012 |
14.25% |
| 2011 |
72.06% |
| 2010 |
33.10% |
| 2009 |
10.31% |
| 2008 |
-22.35% |
| 2007 |
30.57% |
| 2006 |
62.47% |
| 2005 |
329.02% |
| 2004 |
339.73% |
| 2003 |
98.12% |
| 2002 |
2.93% |
| 2001 |
10.16% |
| 2000 |
-10.14% |
| 1999 |
-18.82% |
| 1998 |
196.56% |
| 1997 |
70.58% |
| 1996 |
54.56% |
| 1995 |
-62.07% |
| 1994 |
-30.23% |
| 1993 |
-41.67% |
| 1992 |
108.83% |
| 1991 |
20.00% |
| 1990 |
22.22% |
| 1989 |
-59.46% |
| 1988 |
196.00% |
| 1987 |
-66.67% |
| 1986 |
-40.00% |
| 1985 |
0.00% |