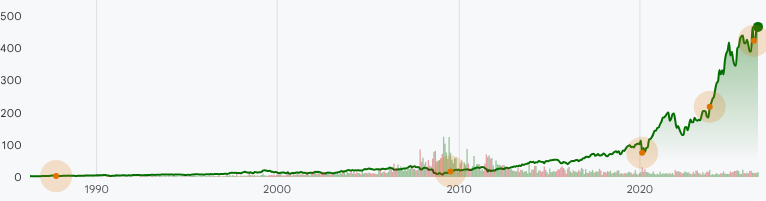
TT:NYSE Stock Prices Over the Years
Annual Stock Price Performance
| Year |
Performance |
| 2026 |
17.60% |
| 2025 |
4.62% |
| 2024 |
55.05% |
| 2023 |
44.44% |
| 2022 |
-12.22% |
| 2021 |
42.17% |
| 2020 |
41.89% |
| 2019 |
47.88% |
| 2018 |
4.93% |
| 2017 |
19.85% |
| 2016 |
38.92% |
| 2015 |
-10.90% |
| 2014 |
5.22% |
| 2013 |
58.09% |
| 2012 |
51.68% |
| 2011 |
-35.33% |
| 2010 |
30.90% |
| 2009 |
94.53% |
| 2008 |
-60.39% |
| 2007 |
21.60% |
| 2006 |
-1.66% |
| 2005 |
3.86% |
| 2004 |
21.38% |
| 2003 |
54.53% |
| 2002 |
3.96% |
| 2001 |
4.56% |
| 2000 |
-19.66% |
| 1999 |
18.83% |
| 1998 |
16.60% |
| 1997 |
40.26% |
| 1996 |
21.65% |
| 1995 |
13.84% |
| 1994 |
-17.07% |
| 1993 |
28.99% |
| 1992 |
9.18% |
| 1991 |
53.80% |
| 1990 |
-24.53% |
| 1989 |
52.49% |
| 1988 |
-2.73% |
| 1987 |
59.89% |
| 1986 |
9.85% |
| 1985 |
24.68% |
| 1984 |
-6.71% |
| 1983 |
41.79% |
| 1982 |
-31.45% |
| 1981 |
-24.54% |
| 1980 |
38.66% |