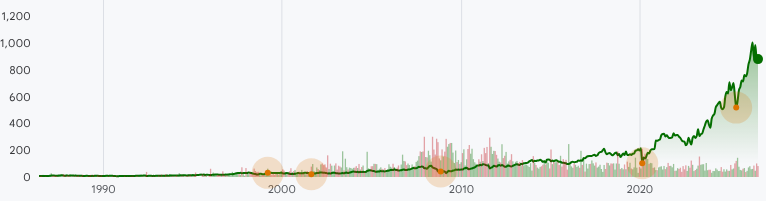
PH:NYSE Stock Prices Over the Years
Annual Stock Price Performance
| Year |
Performance |
| 2026 |
-1.24% |
| 2025 |
40.68% |
| 2024 |
40.21% |
| 2023 |
60.39% |
| 2022 |
-6.29% |
| 2021 |
21.14% |
| 2020 |
32.25% |
| 2019 |
39.58% |
| 2018 |
-24.11% |
| 2017 |
42.32% |
| 2016 |
48.06% |
| 2015 |
-23.19% |
| 2014 |
3.10% |
| 2013 |
49.36% |
| 2012 |
10.02% |
| 2011 |
-11.34% |
| 2010 |
60.85% |
| 2009 |
21.87% |
| 2008 |
-39.30% |
| 2007 |
48.78% |
| 2006 |
16.78% |
| 2005 |
-10.48% |
| 2004 |
28.71% |
| 2003 |
26.73% |
| 2002 |
1.24% |
| 2001 |
6.08% |
| 2000 |
-8.06% |
| 1999 |
56.49% |
| 1998 |
-27.17% |
| 1997 |
83.26% |
| 1996 |
13.62% |
| 1995 |
16.16% |
| 1994 |
24.74% |
| 1993 |
26.85% |
| 1992 |
0.20% |
| 1991 |
31.97% |
| 1990 |
-7.06% |
| 1989 |
-6.65% |
| 1988 |
-21.36% |
| 1987 |
39.24% |
| 1986 |
4.11% |
| 1985 |
25.28% |
| 1984 |
-9.35% |
| 1983 |
72.73% |
| 1982 |
-2.84% |
| 1981 |
-27.95% |
| 1980 |
22.64% |